Protohaund
Protohaund is an engineering application for protocol analysis and communication monitoring on Windows. Its main purposes are to examine request and response sequences, identify communication errors between devices, and track changes in message streams.
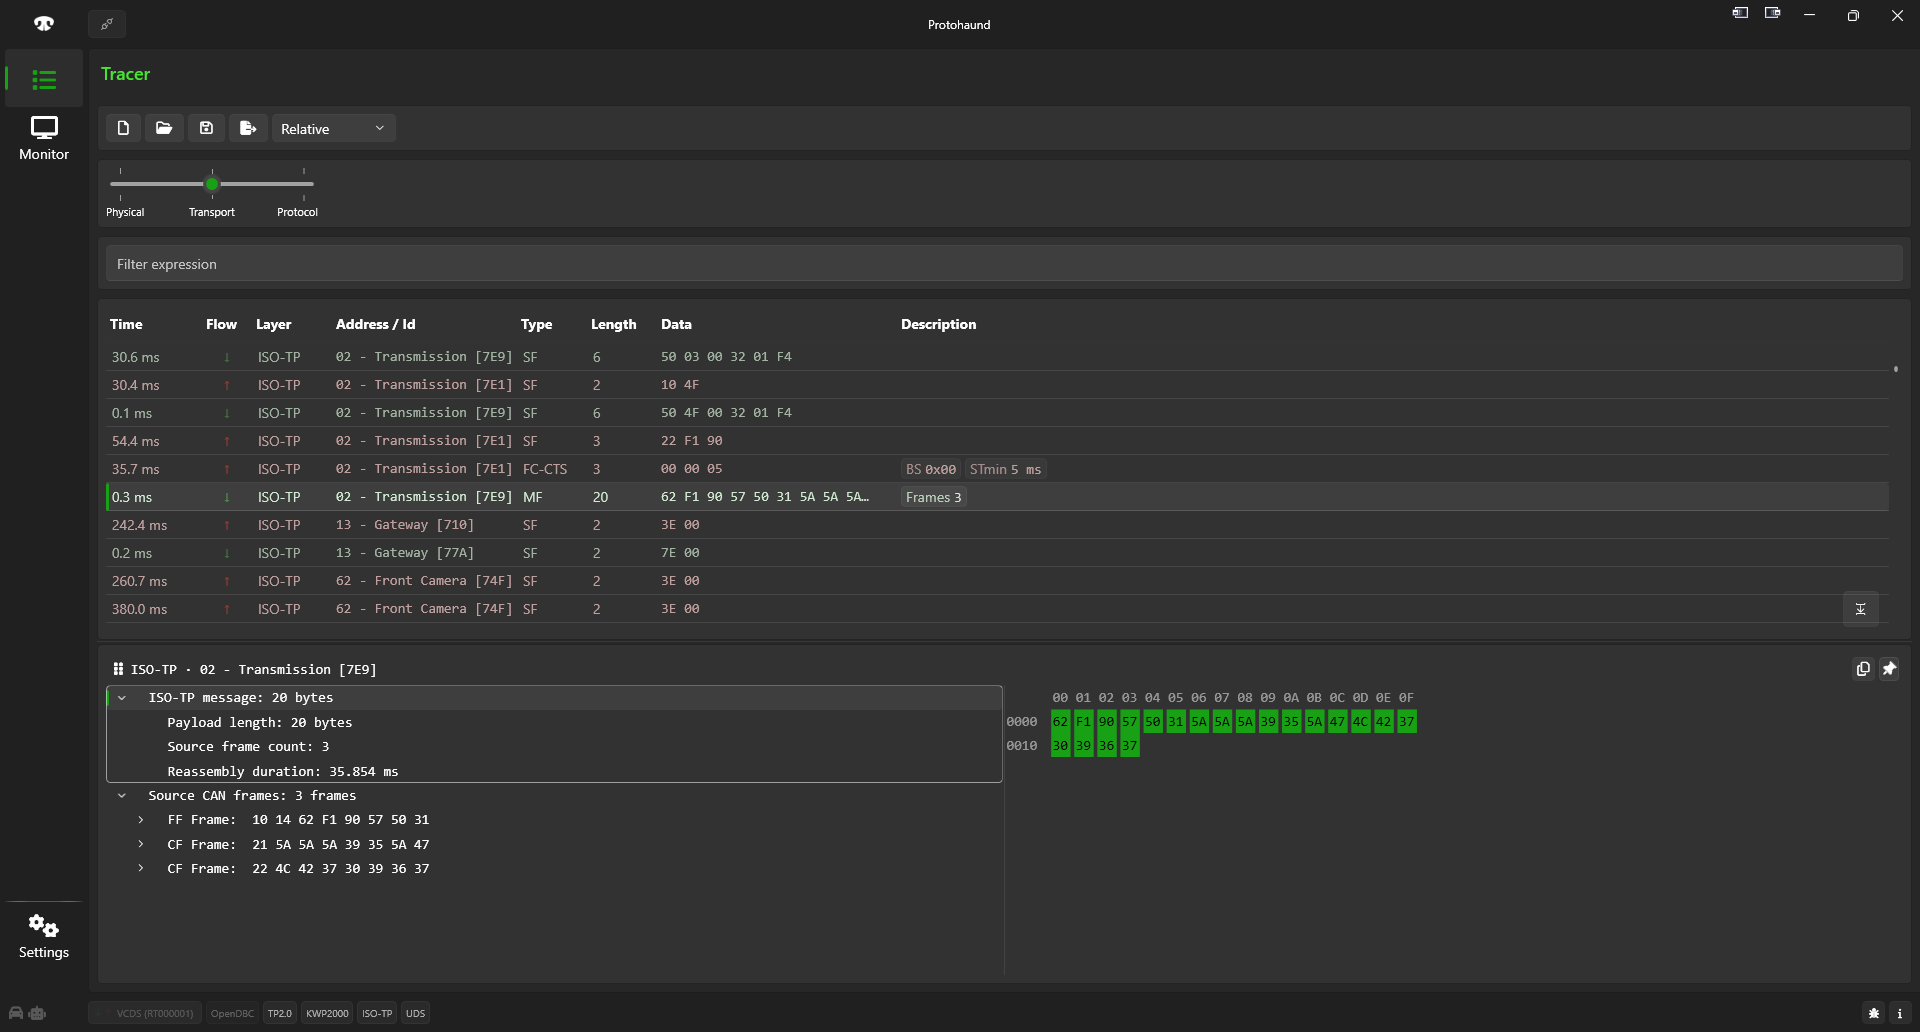
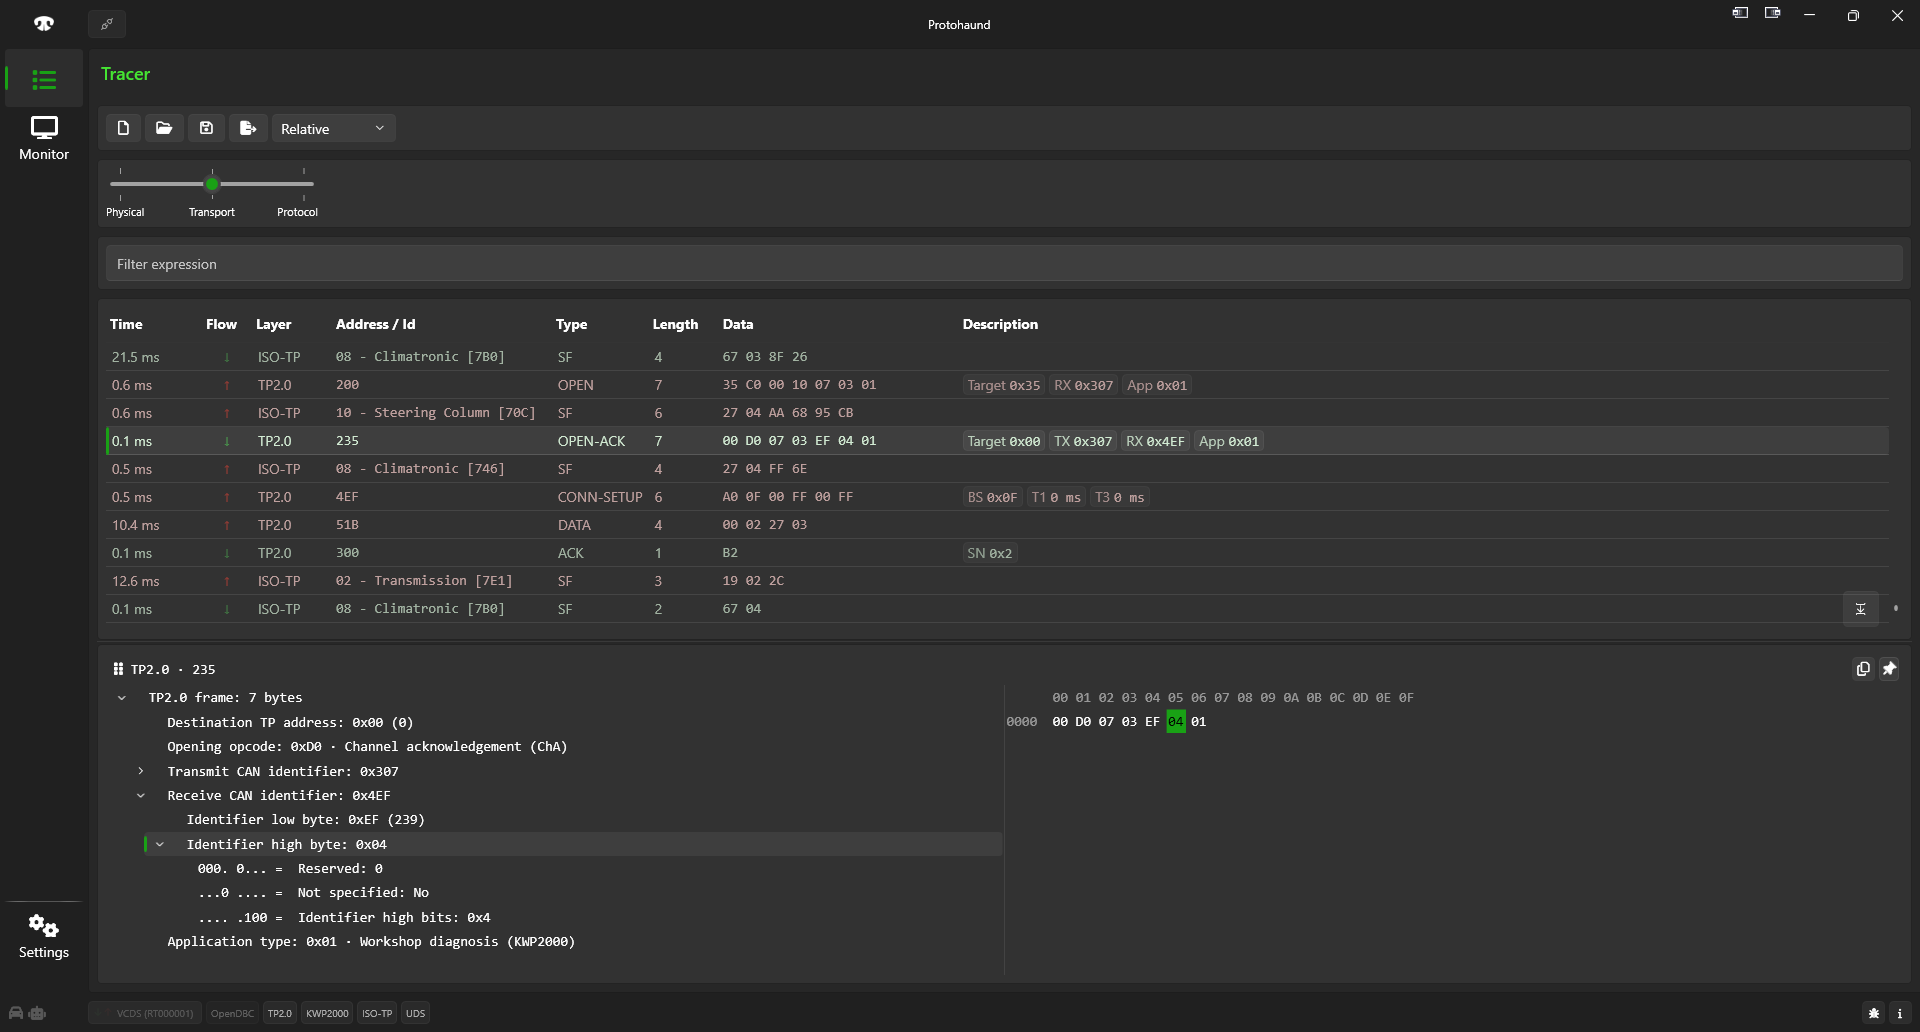
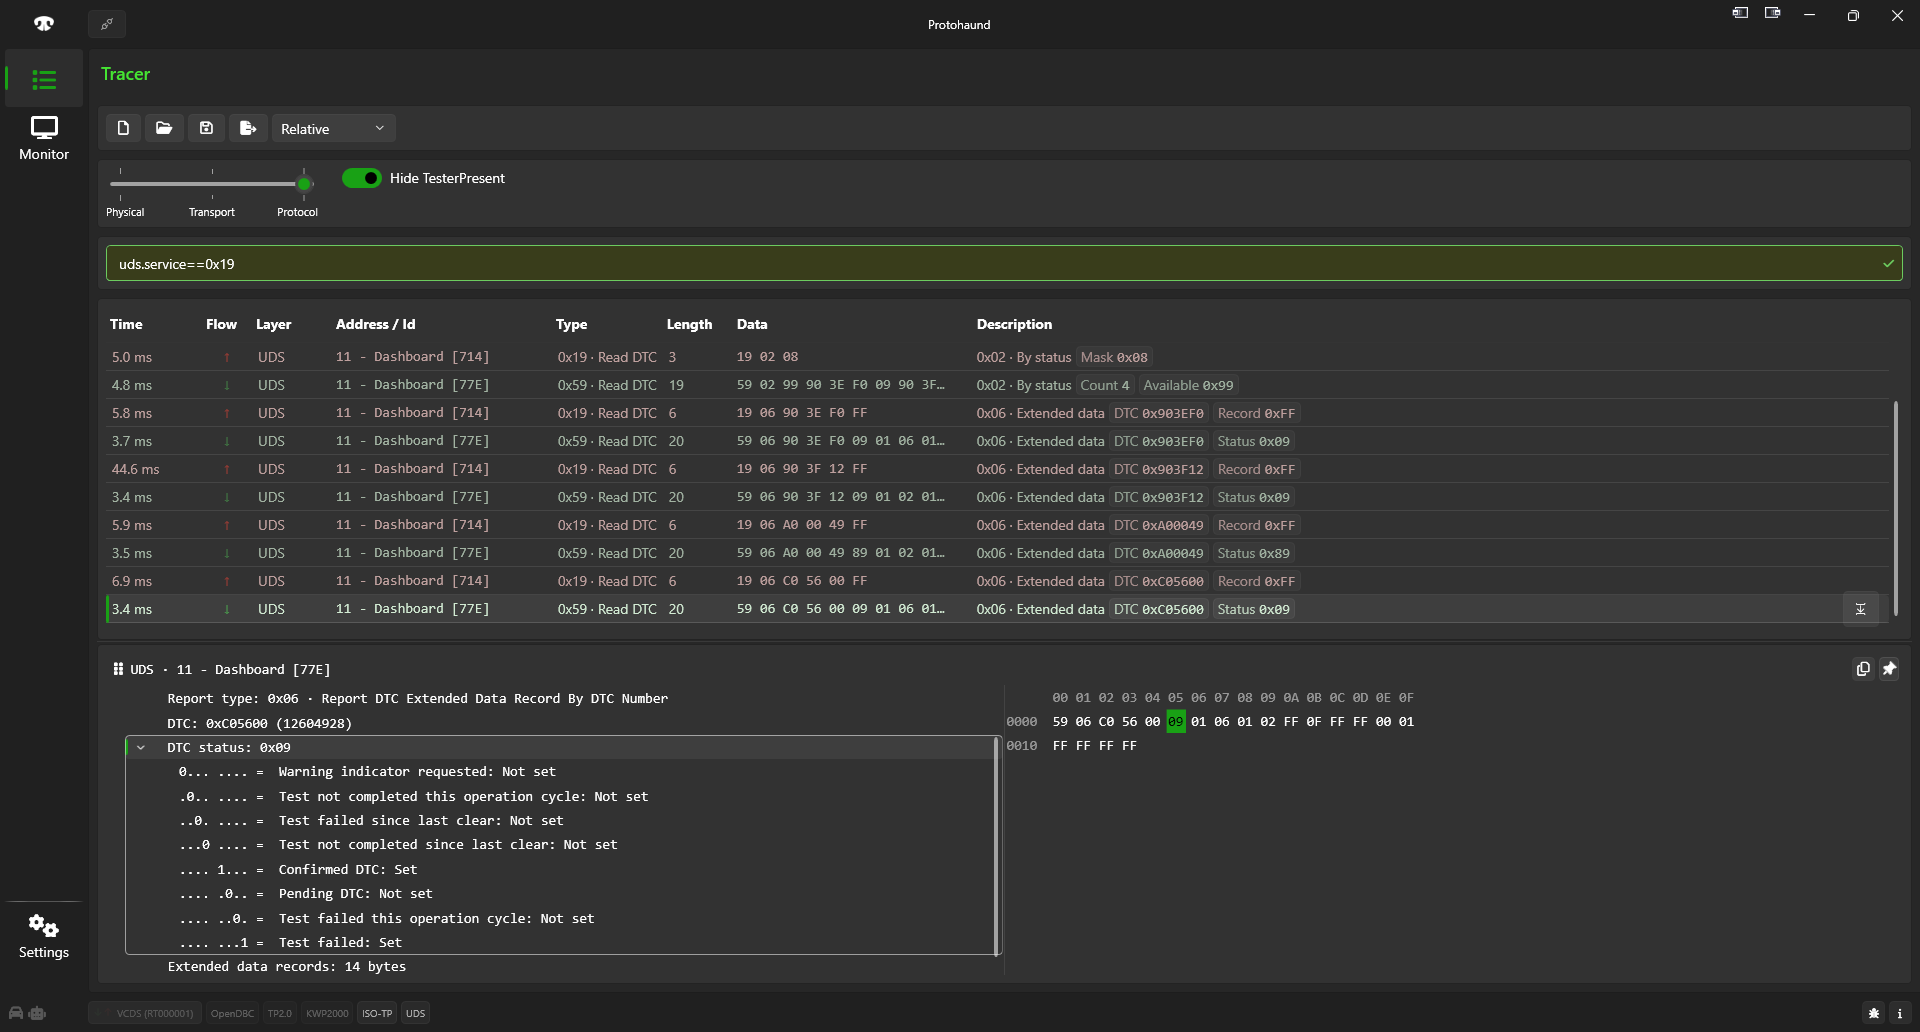
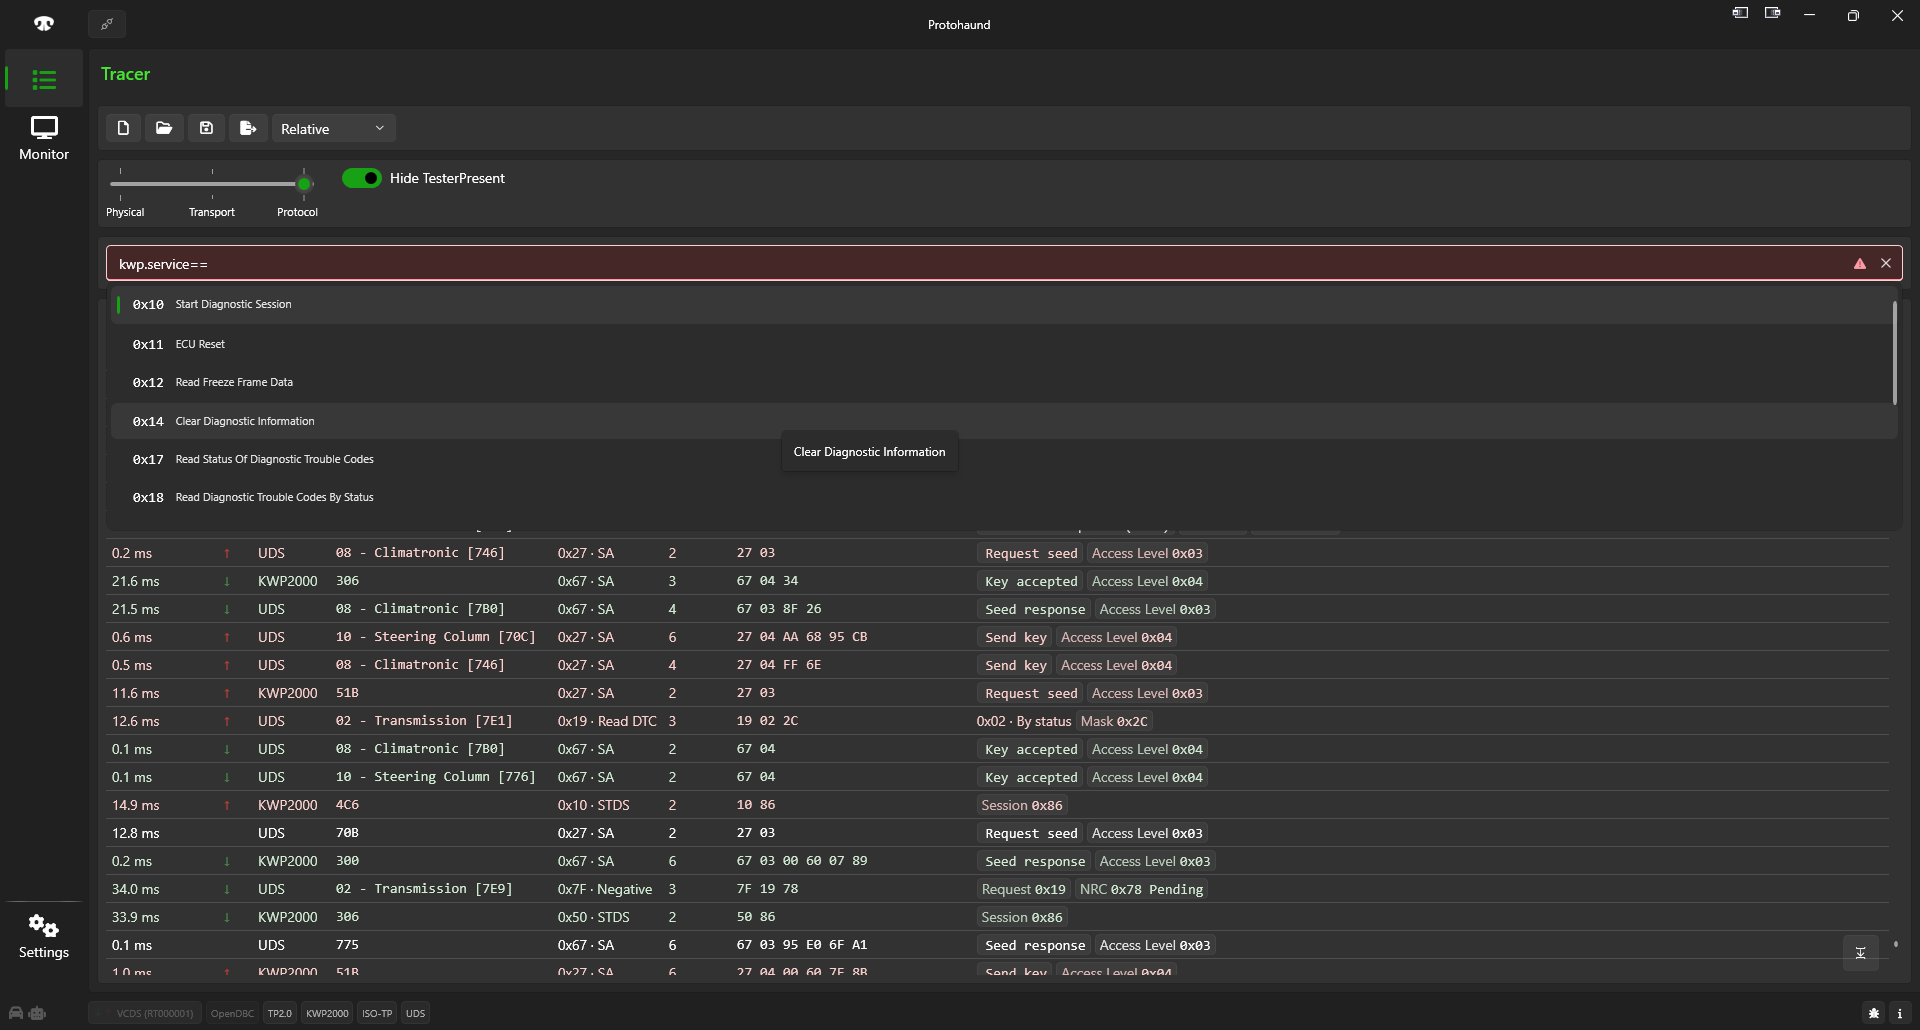
The beta includes the industrial profile with Modbus RTU and CANopen modules and the automotive profile with the VAG module. Each module includes Tracer and Monitor. A built-in MCP server provides integration with AI assistants.
Supported profiles and protocols
Industrial profile — Modbus RTU
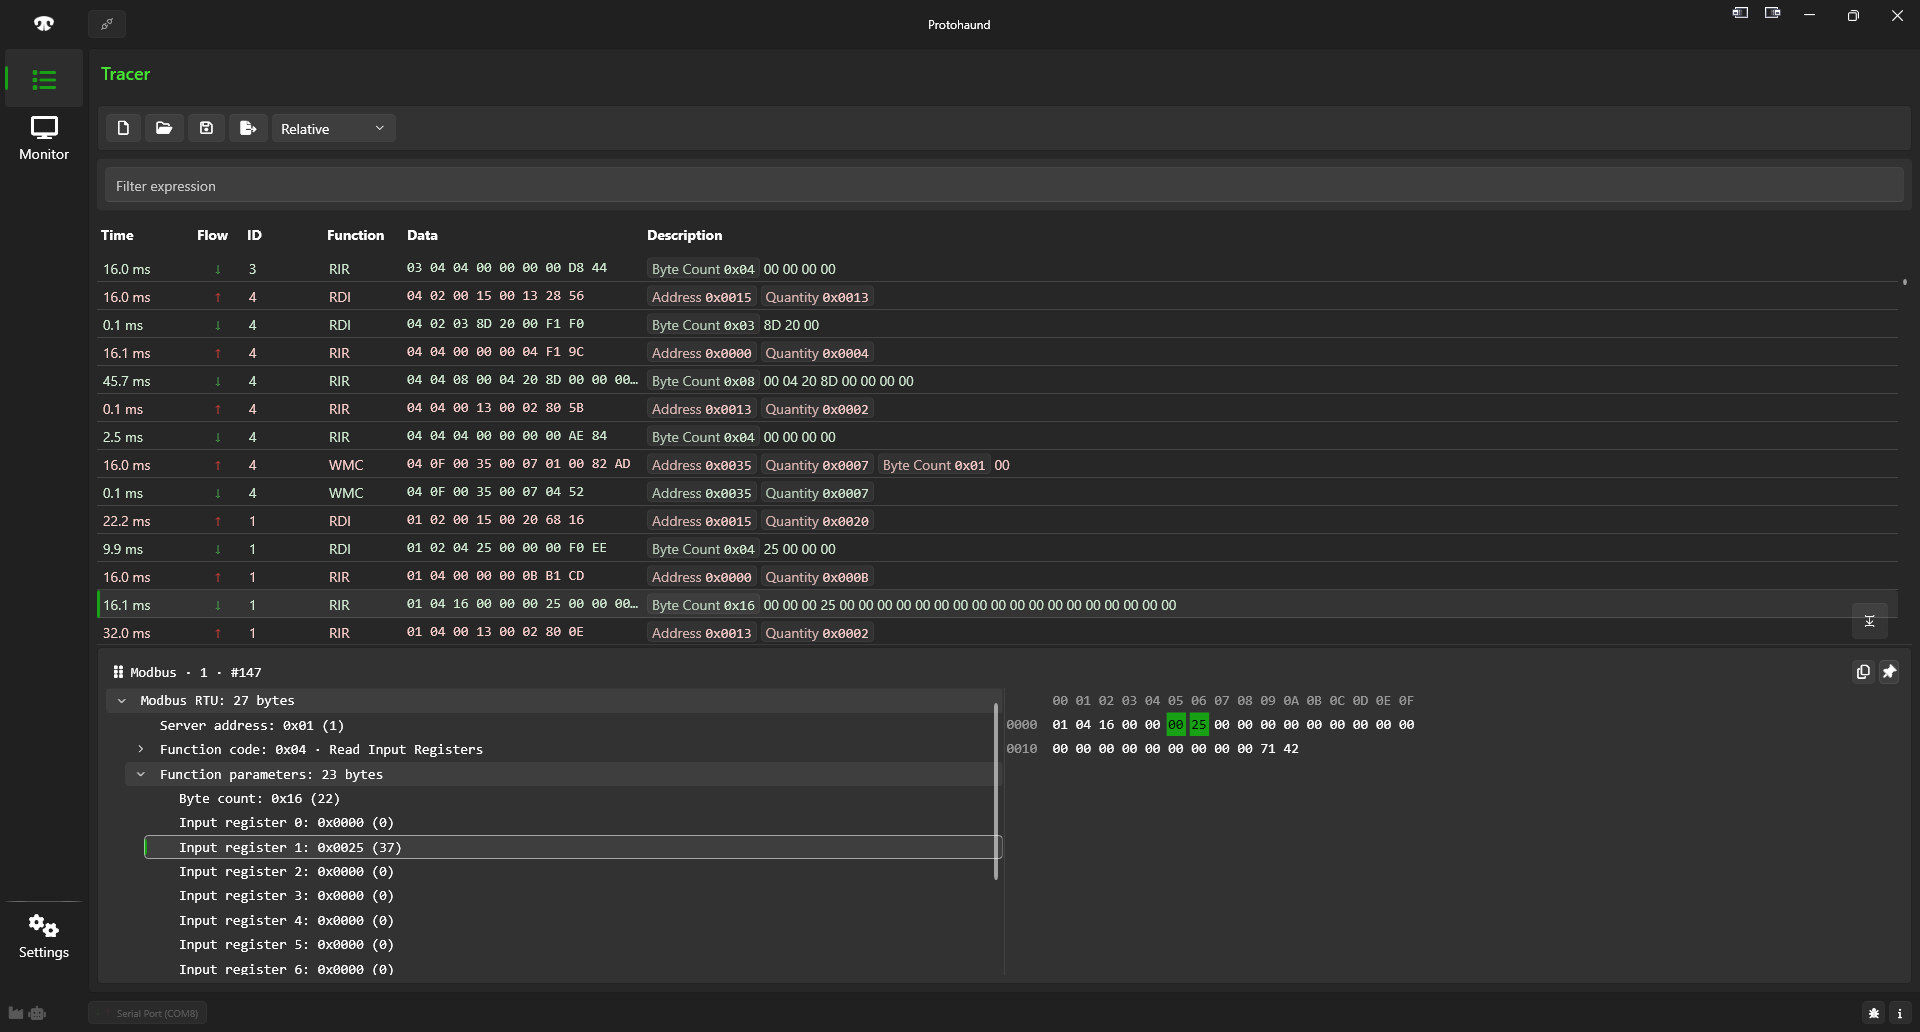
The Modbus RTU module is designed to examine communication between industrial devices over a serial line. Decoded requests and responses show device addresses, protocol functions, register and discrete data access, transferred data, and exception responses. Response times are calculated for matched requests and responses. Passive monitoring observes communication without interfering with it.
Industrial profile — CANopen
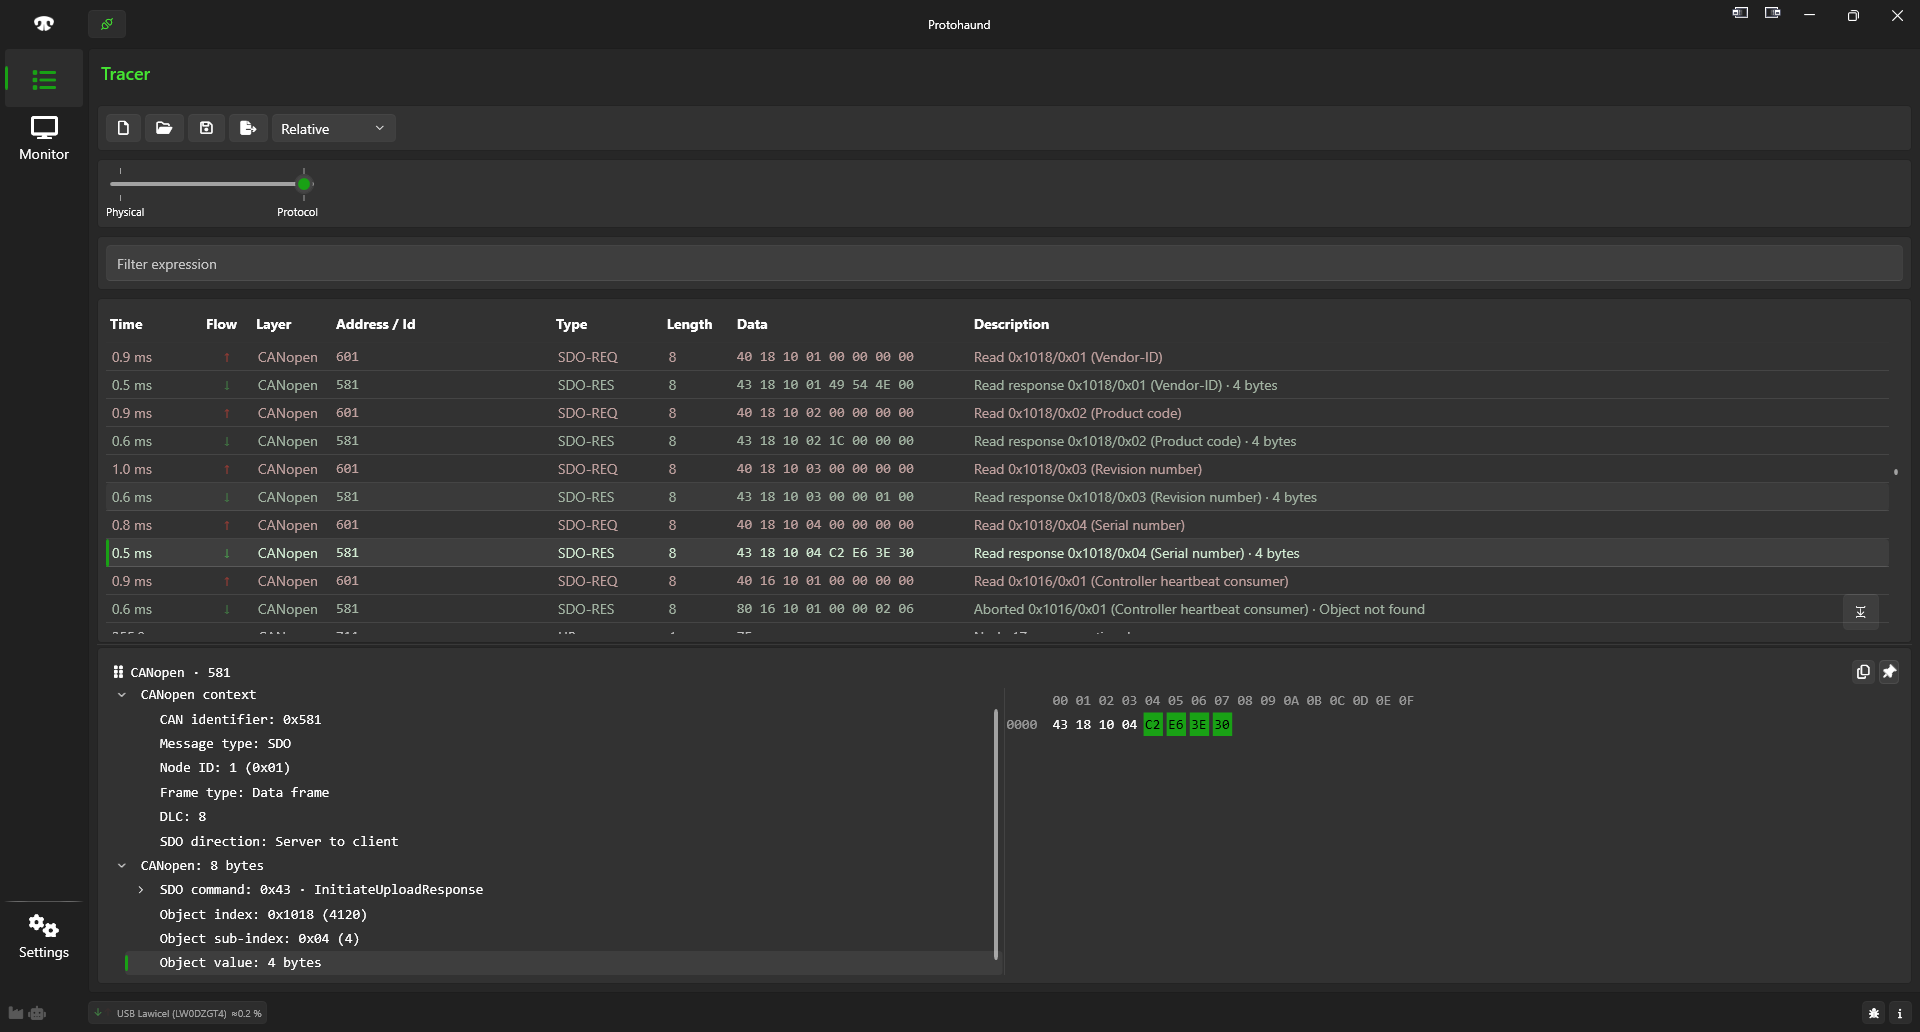
CANopen analysis focuses on node operation and object data exchange. Alongside raw CAN frames, it provides NMT network management, Heartbeat status monitoring, EMCY emergency messages, and SDO and PDO data transfers. The trace captures device startup, object access, and error messages. EDS and DCF descriptions enrich records with object names and data types, while PDO values are decoded using the object mapping specified in the device description.
Automotive profile — VAG
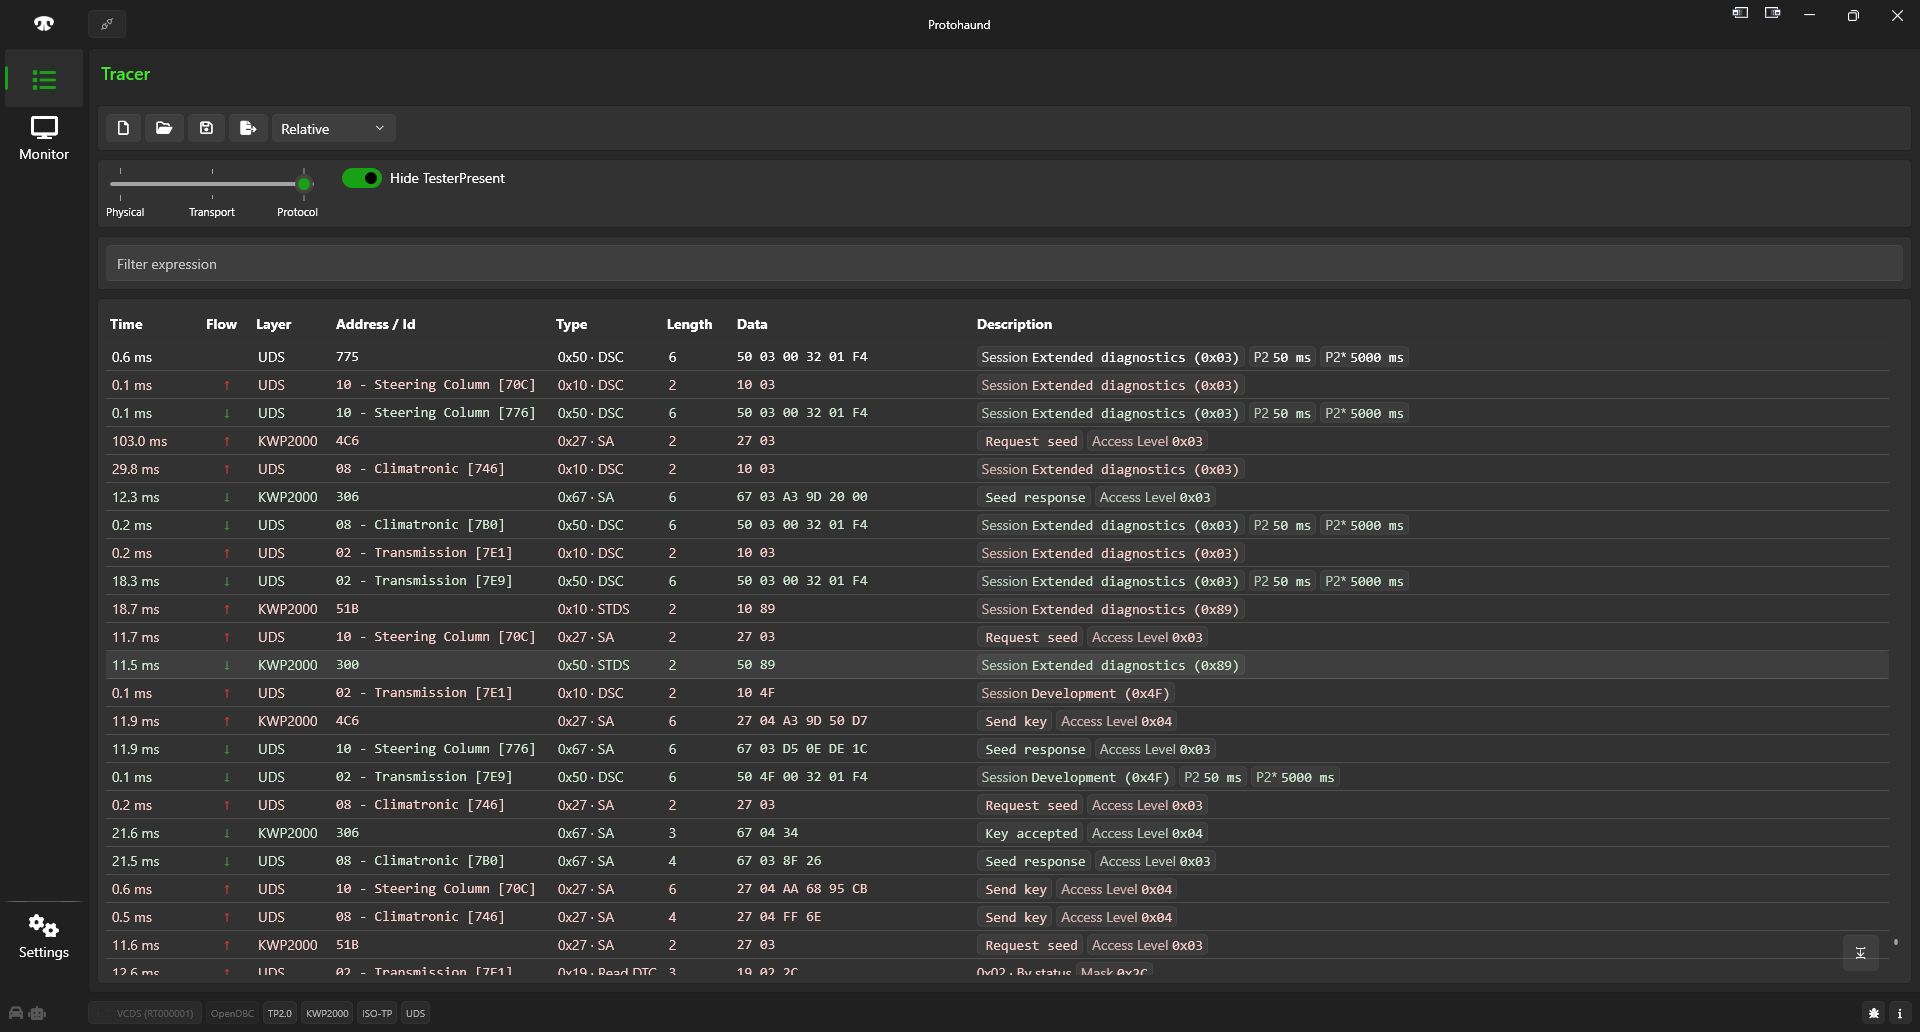
The VAG profile is designed to examine diagnostic communication with vehicle electronic control units over CAN. Communication is presented at three levels: raw CAN frames, ISO-TP and TP2.0 transport messages, and UDS and KWP2000 application messages. Correlating frames with request and response contents makes it possible to follow diagnostic operations and identify negative response codes.
Analysis tools
- Tracer
- Tracer provides a detailed view of the communication sequence. Messages appear in the order observed, together with raw bytes and decoded protocol data. User-defined labels mark significant events for further analysis.
- Monitor
- Monitor provides a summary of observed communication to track its state and changes. For Modbus RTU, it displays the latest values, operation intervals, and operation status; for CAN, it shows frame contents, intervals, and counts. Highlighting of changed bytes and bits reveals changes in CAN data. Monitoring is passive.
- Saving and reanalyzing traces
- Saved traces allow communication to be examined again without connected hardware. CAN recordings are saved in PTRC, and Modbus RTU recordings in PTRBS. The CANopen and VAG modules also support importing TRC CAN traces in CAN Hacker format. Raw messages can be exported to a
.logtext file for use outside the application. - Filtering
- Filtering narrows analysis to messages that match specified conditions. Selection criteria use protocol field values and data contents. The user guide and filter reference are available on the Protohaund documentation website.
MCP server — AI assistant integration
The built-in MCP server gives compatible AI assistants information about the active profile and connection, access to trace reading, message searches by specified conditions, and communication summaries. The integration supports record analysis and automation of repetitive operations without manually transferring data.
Users configure access and permissions separately for each running application instance. Available operations depend on the selected module, license, and granted permissions.
Interfaces and adapters
Modbus RTU connections use Windows serial ports, including USB–RS-485 converters. Supported CAN adapters include CANable, J2534, FTDI-based Lawicel and HEX-USB+CAN adapters, and UCCB.
Modular distribution allows components to be selected according to the protocols and hardware in use. Connection capabilities depend on the adapter model, firmware, and driver.